Introduction
My son plays 5 pin bowling and is a member of YBC Canada. I used to keep track of his averages and some statistics using a spreadsheet. I would enter the data after the end of every series of games and then copy the cells down so that the formula were applied and the correct statistics were calculated. This process worked well enough except I started to notice small discrepancies between my calculations and the posted results.
Why Spreadsheets Suck
I investigated my calculations and it turns out that the average calculation didn’t have a proper anchor cell set. That means that when the cells were copied down, the block of cells used to calculate the averages would shift down as well. It took awhile to detect the error as the averages were only out by a very small amount at first. As time went on, the differences were obvious.
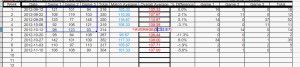
This shows how the cells should be properly anchored so that when the formula are copied to new cells the overall average is calculated correctly.
I have had this happen in numerous situations over the years. It clearly illustrates the dangers of using a spreadsheet without properly fixing your calculations. You will get unexpected sometimes subtle results. I am not the only one that has noticed these potential pitfalls the European Spreadsheet Risks Interest Group has a number of stories that spreadsheet miscalculations have caused some serious problems. Here is another “Worst Spreadsheet Blunders” with some more examples.
In a quest to improve things for myself I wrote up a small python script that did the calculations.This script was pretty simple and it mirrored the way that I had done the calculations in the spreadsheet. It worked, but was not worth sharing or writing about. I re-wrote the script entirely from the ground up. I used python 3 and test driven development methods.
TDD – Test Driven Development
There is a lot of information out there about Test Driven Development. Basically it is a different way of looking at the development process. Essentially the developer writes so-called unit tests to test specific code functionality. The real twist is that tests are written first and the code that makes them pass is written after the first initial failing test. This means that you initially write a test that fails. The other basic idea is that you write only the minimal amount of code to make the test pass – nothing more. I followed some of the basics in this tutorial. I really liked the TDD approach to software design. It allowed me to think about the object model in terms of code that would actually be using the API that I was creating. It also allowed me to think about how the parts of the system would interact. I found my self creating large classes and monolithic solutions. At which point I would stop and think, ‘Can I make this simpler?’. In most cases, the code could be simplified. Originally I had classes that would parse the bowl file stream. These were demoted down to simple functions.
During the course of a TDD cycle, I realized that I would have some trouble testing code around parsing the bowl file. I had a flash of insight and realized that I could test the parsing could by passing it a memory stream to simulate a file stream. This worked remarkable well! In the end I will probably develop more software using the TDD approach. In the end when I was done, it was a simple matter of ‘wiring’ the units together to form a functional program.
What the Program Does
The program processes bowling data and generates statistics that are geared towards 5-pin bowling. It generates the following statistics:
- Total Pins – The total number of pins (points) that were scored for the series of games.
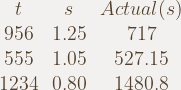
- Average – The average pins (points) for the games in the series.
- Season Average – The cumulative average of all the games from the start of the season.
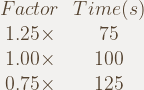
- % Difference – The percentage difference from the series average vs. the season average. It is a good performance indicator. This value can be positive or negative. Positive values indicate an increase in average.
- Pins Over Average – This is the number of pins (points) for each game in the series over the season average. For example, if the season average (including the current series of games) is 150 and each of the games in the series is 125, 165, 170. The pins over average would be 0, 15, 20.
- Total Pins Over – The sum of the Pins Over Average statistic.
┌────────────┬────────────────────────┬────────────┬─────────┬────────────────┬──────────────┬───────────────────┬─────────────────┐
│    Date    │        Matches         │ Total Pins │ Average │ Season Average │ % Difference │ Pins Over Average │ Total Pins Over │
├────────────┼────────────────────────┼────────────┼─────────┼────────────────┼──────────────┼───────────────────┼─────────────────┤
│ 2012-09-15 │    121,    101,     94 │    316     │ 105.33  │     105.33     │    +0.00     │    16,   0,   0   │       16        │
├────────────┼────────────────────────┼────────────┼─────────┼────────────────┼──────────────┼───────────────────┼─────────────────┤
│ 2012-09-22 │    108,    119,    103 │    330     │ 110.00  │     107.67     │    +2.12     │     0,  11,   0   │       11        │
├────────────┼────────────────────────┼────────────┼─────────┼────────────────┼──────────────┼───────────────────┼─────────────────┤
│ 2012-09-29 │    125,     77,    148 │    350     │ 116.67  │     110.67     │    +5.14     │    14,   0,  37   │       51        │
├────────────┼────────────────────────┼────────────┼─────────┼────────────────┼──────────────┼───────────────────┼─────────────────┤
│ 2012-10-06 │     92,    106,    121 │    319     │ 106.33  │     109.58     │    -3.06     │     0,   0,  11   │       11        │
├────────────┼────────────────────────┼────────────┼─────────┼────────────────┼──────────────┼───────────────────┼─────────────────┤
│ 2012-10-12 │     98,    123,     93 │    314     │ 104.67  │     108.60     │    -3.76     │     0,  14,   0   │       14        │
├────────────┼────────────────────────┼────────────┼─────────┼────────────────┼──────────────┼───────────────────┼─────────────────┤
│ 2012-10-20 │     95,     84,    108 │    287     │  95.67  │     106.44     │    -11.27    │     0,   0,   2   │        2        │
├────────────┼────────────────────────┼────────────┼─────────┼────────────────┼──────────────┼───────────────────┼─────────────────┤
│ 2012-10-27 │    142,    101,    109 │    352     │ 117.33  │     108.00     │    +7.95     │    34,   0,   1   │       35        │
├────────────┼────────────────────────┼────────────┼─────────┼────────────────┼──────────────┼───────────────────┼─────────────────┤
│ 2012-11-03 │    110,     97,    110 │    317     │ 105.67  │     107.71     │    -1.93     │     2,   0,   2   │        4        │
├────────────┼────────────────────────┼────────────┼─────────┼────────────────┼──────────────┼───────────────────┼─────────────────┤
│ 2012-11-10 │    106,    108,     90 │    304     │ 101.33  │     107.00     │    -5.59     │     0,   1,   0   │        1        │
├────────────┼────────────────────────┼────────────┼─────────┼────────────────┼──────────────┼───────────────────┼─────────────────┤
│ 2012-11-17 │    123,    126,     98 │    347     │ 115.67  │     107.87     │    +6.74     │    15,  18,   0   │       33        │
├────────────┼────────────────────────┼────────────┼─────────┼────────────────┼──────────────┼───────────────────┼─────────────────┤
│ 2012-11-23 │     97,     94,    106 │    297     │  99.00  │     107.06     │    -8.14     │     0,   0,   0   │        0        │
├────────────┼────────────────────────┼────────────┼─────────┼────────────────┼──────────────┼───────────────────┼─────────────────┤
│ 2012-12-01 │    138,    131,    114 │    383     │ 127.67  │     108.78     │    +14.80    │    29,  22,   5   │       56        │
├────────────┼────────────────────────┼────────────┼─────────┼────────────────┼──────────────┼───────────────────┼─────────────────┤
│ 2012-12-08 │    133,    120,    102 │    355     │ 118.33  │     109.51     │    +7.45     │    23,  10,   0   │       33        │
├────────────┼────────────────────────┼────────────┼─────────┼────────────────┼──────────────┼───────────────────┼─────────────────┤
│ 2012-12-15 │    184,    131,    121 │    436     │ 145.33  │     112.07     │    +22.89    │    72,  19,   9   │       100       │
├────────────┼────────────────────────┼────────────┼─────────┼────────────────┼──────────────┼───────────────────┼─────────────────┤
│ 2012-12-22 │    172,    104,    139 │    415     │ 138.33  │     113.82     │    +17.72    │    58,   0,  25   │       83        │
├────────────┼────────────────────────┼────────────┼─────────┼────────────────┼──────────────┼───────────────────┼─────────────────┤
│ 2013-01-05 │    132,    176,    118 │    426     │ 142.00  │     115.58     │    +18.60    │    16,  60,   2   │       78        │
├────────────┼────────────────────────┼────────────┼─────────┼────────────────┼──────────────┼───────────────────┼─────────────────┤
│ 2013-01-10 │    138,     92,    130 │    360     │ 120.00  │     115.84     │    +3.46     │    22,   0,  14   │       36        │
├────────────┼────────────────────────┼────────────┼─────────┼────────────────┼──────────────┼───────────────────┼─────────────────┤
│ 2013-01-19 │     98,    142,    161 │    401     │ 133.67  │     116.83     │    +12.59    │     0,  25,  44   │       69        │
├────────────┼────────────────────────┼────────────┼─────────┼────────────────┼──────────────┼───────────────────┼─────────────────┤
│ 2013-01-26 │     97,    136,    129 │    362     │ 120.67  │     117.04     │    +3.01     │     0,  19,  12   │       31        │
├────────────┼────────────────────────┼────────────┼─────────┼────────────────┼──────────────┼───────────────────┼─────────────────┤
│ 2013-02-02 │     97,    108,    119 │    324     │ 108.00  │     116.58     │    -7.95     │     0,   0,   2   │        2        │
├────────────┼────────────────────────┼────────────┼─────────┼────────────────┼──────────────┼───────────────────┼─────────────────┤
│ 2013-02-09 │    109,     90,    108 │    307     │ 102.33  │     115.90     │    -13.26    │     0,   0,   0   │        0        │
├────────────┼────────────────────────┼────────────┼─────────┼────────────────┼──────────────┼───────────────────┼─────────────────┤
│ 2013-02-16 │    108,    117,    117 │    342     │ 114.00  │     115.82     │    -1.59     │     0,   1,   1   │        2        │
├────────────┼────────────────────────┼────────────┼─────────┼────────────────┼──────────────┼───────────────────┼─────────────────┤
│ 2013-02-23 │    108,    115,     96 │    319     │ 106.33  │     115.41     │    -8.53     │     0,   0,   0   │        0        │
├────────────┼────────────────────────┼────────────┼─────────┼────────────────┼──────────────┼───────────────────┼─────────────────┤
│ 2013-03-02 │    137,    112,    121 │    370     │ 123.33  │     115.74     │    +6.16     │    21,   0,   5   │       26        │
├────────────┼────────────────────────┼────────────┼─────────┼────────────────┼──────────────┼───────────────────┼─────────────────┤
│ 2013-03-09 │    124,     86,     87 │    297     │  99.00  │     115.07     │    -16.23    │     9,   0,   0   │        9        │
├────────────┼────────────────────────┼────────────┼─────────┼────────────────┼──────────────┼───────────────────┼─────────────────┤
│ 2013-03-15 │    138,    121,    185 │    444     │ 148.00  │     116.33     │    +21.40    │    22,   5,  69   │       96        │
├────────────┼────────────────────────┼────────────┼─────────┼────────────────┼──────────────┼───────────────────┼─────────────────┤
│ 2013-03-23 │    117,    101,    158 │    376     │ 125.33  │     116.67     │    +6.91     │     0,   0,  41   │       41        │
├────────────┼────────────────────────┼────────────┼─────────┼────────────────┼──────────────┼───────────────────┼─────────────────┤
│            │ 120.26, 111.78, 117.96 │    9450    │         │                │              │                   │       840       │
└────────────┴────────────────────────┴────────────┴─────────┴────────────────┴──────────────┴───────────────────┴─────────────────┘
In addition, badge a table of badge levels can be calculated. The following levels are calculated:
- High/Low – Determines the highest and lowest scores from all of the games within the season and also records the date that the score was recorded. It also determines the high and low triples, that is the sum of the series.
- Pins Over Average – Calculates the total pins over average on a monthly basis.
- Singles – Displays a series of buckets and tallies where the players scores falls into particular buckets.
- Triples – Displays a series of buckets and tallies where the players scores falls into particular buckets.
┌─────────────────────────────────┬───────────────────┬──────────────┬──────────────┐
│            High/Low             │ Pins Over Average │   Singles    │   Triples    │
├─────────────────────────────────┼───────────────────┼──────────────┼──────────────┤
│ High Singles = 185 (2013-03-15) │   2012-09 = 78    │  75-99 = 20  │ 350-399 = 8  │
├─────────────────────────────────┼───────────────────┼──────────────┼──────────────┤
│  Low Singles = 77 (2012-09-29)  │   2012-10 = 62    │ 100-124 = 37 │ 400-449 = 4  │
├─────────────────────────────────┼───────────────────┼──────────────┼──────────────┤
│ High Triples = 444 (2013-03-15) │   2012-11 = 38    │ 125-149 = 16 │ 450-499 = 0  │
├─────────────────────────────────┼───────────────────┼──────────────┼──────────────┤
│ Low Triples = 287 (2012-10-20)  │   2012-12 = 172   │ 150-174 = 3  │ 500-549 = 0  │
├─────────────────────────────────┼───────────────────┼──────────────┼──────────────┤
│                                 │   2013-01 = 214   │ 175-199 = 2  │ 550-599 = 0  │
├─────────────────────────────────┼───────────────────┼──────────────┼──────────────┤
│                                 │    2013-02 = 4    │ 200-224 = 0  │ 600-649 = 0  │
├─────────────────────────────────┼───────────────────┼──────────────┼──────────────┤
│                                 │   2013-03 = 172   │ 225-249 = 0  │ 650-699 = 0  │
├─────────────────────────────────┼───────────────────┼──────────────┼──────────────┤
│                                 │                   │ 250-450 = 0  │ 700-1350 = 0 │
└─────────────────────────────────┴───────────────────┴──────────────┴──────────────┘
In addition, the bowling data can be ‘tagged’. This means that you can store non-league data in the same file and generate statistics from it without affecting the league statistics. With the proper option set when the program is launched, all of the tables will be displayed. There is also an ability to write the tables to a text file. The program can be run on multiple bowl files and generate the statistics individually.
How to use it
The program is easy to use. Issue the following command at a command prompt:
$ python3 bowling_stats.py ~/bowling_data/*.bowl
All of the bowl files located in ~/bowling_data will be processed and the statistics will be displayed in the terminal. There are a number of command line switches that the program accepts as well.
Here is a listing of the available switches:
$ python3 bowling_stats.py -h
usage: bowling_stats.py [-h] [-d] [-f] [-b] path

positional arguments:
  path           The name and path of the *.bowl file to process. Unix
                 wildcards can be used. (default = *.bowl)

optional arguments:
  -h, --help     show this help message and exit
  -d, --details  Display tables for all tagged data.
  -f, --file     Write the statistics to an output file.
  -b, --badges   Generate the badge level tables.
Data Format
The bowl file is used to capture bowling data from an individual bowler. It consists of header data and the actual match data. It consists of lines of data interspaced with comments. Comments are lines that the program will ignore when processing the file. A comment is a line that starts with the hash (#) character. These lines will be ignored. Comments can be in-line with text. Anything after the comment character will be ignored.
The header consists of the bowlers: name, division, lane, season and id. The division can be anything, but is typically, bantam, junior or senior. The lane is the name of the home bowling alley. Season is the year in which the data was/is collected and the id is a numeric identifer for the player. The header also needs to end with a ‘#-‘ character combination or an empty line.
The bowling data consists of 3 parts: A date, a number of game scores, and a list of ‘tags’. The date is expressed in the iso standard format: yyyy-mm-dd. This is the least ambiguous date representation. The date is separated from the games scores by a comma (,). The game scores are a list of scores separated by a comma (,). There can be any number of scores in the list which means that it can accommodate league play and tournament play. The tags are ways to group the match information when the data is processed. By default, if there are no tags associated with the match data it is assumed to be ‘league’ data and will be used in league statistical calculations. To add a tag to the match data, simply add a semi-colon (;) to the end of the match data and type the name of the group to tag the data to. You can use multiple names which are separated by a comma (,).
NOTE: If the match data is league data, then no semi-colon (;) is required.
NOTE: Tags are case sensitive
Special Tags
- league – This is the default type. It isn’t necessary to add this to the matches as it is implied.
- pre-bowl – Matches completed before scheduled league days. There are some rules about how the points are scored against league statistics. Other than that, the values are included within the League results.
Here are examples of other tag groups that can be used:
- Practice – The scores are not counted towards league results
- Tournament – Matches played during a tournament. These values do not go towards league statistics.
Note: other than the league and pre-bowl tags which can have different statistics tied with them, the other values are simply grouped together.
The tags other than league and pre-bowl can be combined in a csv list. For example: (tournament, tournament-high singles). What this will do is group all of the tournament scores into one so the stats can be combined and at the same time separate stats will be
generated for the high singles tournament
For full details on the bowl file format, see the bowler_data(2012-2013).bowl example file. Here is a small excerpt of the file:
#Name: Sample Bowler
#Division: Bantam
#Lane: Home Bowling Alley Name
#Season: 2012 - 2013
#Player ID: c886d8e8-9494-11e2-aee6-5f1d9c8bef1b
#------------------------

#Date (yyyy-mm-dd), Game1, Game2, Game3; Group Tags
2012-09-15, 121, 101,  94
2012-09-22, 108, 119, 103
2012-09-29, 125,  77, 148

2012-10-06,  92, 106, 121
2012-10-12,  98, 123,  93
2012-10-20,  95,  84, 108
2012-10-27, 142, 101, 109

2012-11-03, 110,  97, 110

#I Beat My Coach
2012-11-10, 106, 108,  90

2012-11-17, 123, 126,  98
2012-11-23,  97,  94, 106

#From 2012-12-01 to 2013-01-19 - 4 Steps to stardom qualifiers
2012-12-01, 138, 131, 114
2012-12-08, 133, 120, 102

#High Singles Tournament
#The bowler missed out on third place by 7 points. He ended up in fourth place.
#He had a really good showing for this tournament!
2012-12-09, 146, 142, 116, 153, 137; Tournament, High Singles

#Advance bowling - 2012-12-13 will be used for the league game indicated in the entry
2012-12-15, 184, 131, 121; Pre-bowl

#some good bowling before Christmas
2012-12-22, 172, 104, 139
Installation
The best way to install the program is to clone the repository:
hg clone ssh://hg@bitbucket.org/troy_williams/bowling
Alternatively, you can download the files from here:
https://bitbucket.org/troy_williams/bowling/get/tip.zip
The program requires python 3 to function so you need to make sure that it is installed and operating correctly before you can use the program.